
Journal of Environmental Treatment Techniques 2017, Volume 5, Issue 4, Pages: 132-140
132
Extrapolation of Live Load Effects to 75 Years Return Period for
Highway Bridges
I. Shahid
1
, A.K. Noman
2
, S. H. Farooq
3
, A. Arshad
1
1- Associate professor, MCE, National University of Science & Technology, Risalpur
2- MS student, MCE, National University of Science & Technology, Risalpur
Received: 20/06/2017 Accepted: 12/09/2017 Published: 30/09/2017
Abstract
Design of bridges is primarily governed by the live load models representing truck traffic. In Pakistan, bridges are designed as
per live load models of Pakistan Code of Practice for Highway Bridges 1967 (called herein as “CPHB”) and American Associations
for State Highway and Transportation officials AASHTO LRFD Bridge Design Specifications (called herein as “AASHTO”). CPHB
is based on 1961 American Association of State Highways and Transport Officials (AASHTO) Bridge Design Specifications.Further,
National Highway Authority (NHA) has specified legal limits on the live loads to prevent overstressing of bridges. Live load models
are usually developed from existing truck data. Load model for highway bridges are primarily based on truck load, dead load and
dynamic load. Live load data required for bridge design includes the Gross vehicle weight (GVW), axle weight, axle spacing and
truck configuration.Correct estimation of data plays a vital role in designing of the bridge for intended design period which is 75 years
as per AASHTO LRFD code. Estimating the traffic data is nearly impossible for 75 years as data recording for such a long time is
not possible.However a reasonable result can be achieved by projectingthe collected data to 75 years. Data which is to be projected
is usually collected over a short period ranging from 3 months to one year.Various techniques are used for extrapolation to 75 years
but this paper aims at describing and comparing the test results using non-parametric fit method as was used by (Kozikowski and
Nowak, 2009), Convolution method (NCHRP 683, 2012)and CDF (Cumulative Distribution Function)projection method adopted by
MDOT(Michigan Department of Transportation) for investigation of current design/truck load to calculate maximum 75 years load
effect on the bridge (RC-1413, 2002).
Keywords: Highway Bridge, truck load, Live Load, Weigh in Motion, Non-parametric fit.
1 Introduction
1
Dead Load, live load (static and dynamic), environmental
loads (temperature, earthquake, Wind) and miscellaneous loads
(impact, braking, collision etc) forms the major load components
of highway bridges. Dead load is a gravity load due to self-weight
of bridge componentswhich can be easily estimated and remains
nearly constant throughout the design life. Dynamic load and
other miscellaneous loads can be estimated approximately for the
design of bridges but their event of occurring is restricted to the
particular area and environment. Moreover dynamic load like
high intensity earthquake’s occurrence is also estimated over a
larger return period for extreme event.
Live load over bridges is primarily produced by the moving
vehicles whose intensity and occurrence is highly variable in
nature. Live load effects is influenced by a number of parameters
like span, vehicle weight, number of axle, axle weight, axle
spacing, position of vehicle, girder spacing etc. These parameters
can be recorded using available technologies for a certain period
but is highly site specific. To get the realistic data for 75 years
(design life of a bridge) is nearly impossible due to involvement
of data collection for the same period (75 years).To solve this
problem, data is collected for a particular site for limited period
(say one month, two months or even a year),which is then
projected using statistical approach for finding the maximum load
effects on the bridge for 75 years.In this paper only three methods
(non-parametric fit method, Convolution or numerical integration
method and CDF projection method) were used to project the load
Corresponding author: A. Arshad, Associate professor,
MCE, National University of Science & Technology,
Risalpur. E-mail: aliarshad08@yahoo.com.
effects. Weigh in Motion (WIM)data was acquired from Sangjani
weigh station, Mullan Mansoor weigh station and truck data
recorded at Peshawar.
2 Data Base
Live load is divided into static and dynamic components and
its sum presents the total live load on bridge structure. This study
is concern mainly with the static portion of the load. WIM is used
for collecting the data pertaining to live load due to trucks on
bridges. The information include the gross vehicle weight
(GVW), Axle spacing, Axle weight, number of axles and average
daily truck traffic (ADTT). Live load effects include the moment,
shear and stresses which are used for effective evaluation of a
bridge structure. In this study only moment and shear due to
single truck on the bridge under consideration is considered.
Simply supported pre-stressed Sample Bridge of 47 m span was
selected for WIM data collected at Sangjani and Mullan Mansoor.
While simply supported pre-stressed bridge of 12.8 meter span
was selected for the truck data collected at Peshawar.
2.1 Sangjani Weigh Station
Data acquired from Sangjani weigh station was recorded in
year 2012 for a duration of six months. Number of tucks recored
during this period was 230743 trucks of different configuration.
Table 1 shows the Summary of recorded data. ADTT at this
station represents 1289 vehicles.
Journal weblink: http://www.jett.dormaj.com
J. Environ. Treat. Tech.
ISSN: 2309-1185

Journal of Environmental Treatment Techniques 2017, Volume 5, Issue 4, Pages: 132-140
133
2.2 Mullan Mansoor Weigh Station
104553 trucks of different configuration were recordedfor a
period of three months at Mullan Mansoor weigh station located
on national highway 5 (Islamabad – Peshawar section). Table 2
shows the Summary of recorded data.
2.3 Peshawar (Temporary Weigh Station)
A temporary weigh station was established at
Hayatabad in Peshawar to monitor the truck traffic by
researchers of UET Peshawar (Ali, 2012) in collaboration
with Peshawar Development Authority (PDA). Data
acquired at this site was limited to very few trucks i:e 411
trucks.Table 3 shows the Summary of recorded data at
Peshawar.
3 Maximum Load Effects
Three bridges were selected for calculating the maximum
load effects. All these bridges are simply supported, pre-stressed
concrete girder bridges. Maximum load effects were calculated
using influence lines by running each actual recorded truck on the
bridge. Load effects include maximum moment and maximum
shear due to single truck. Details of bridges under study are as
under:
Table 1: Number of vehicles and maximum GVW in each category – Sangjani
Truck Configuration (Number of Axles)
Total
2
3
4
5
6
7
8
9
10
11
12
Number of Trucks
101022
114606
9282
1787
4014
13
5
8
3
2
1
230743
Max GVW (tons)
32.43
56.59
66.82
86.30
109.30
106.05
123.70
143.80
124.80
136.00
163.40
Table 2: Number of vehicles and maximum GVW in each category – Mansoor
Truck Configuration (Number of Axles)
Total
2
3
4
5
6
7
8
9
10
11
12
Number of Trucks
47593
28907
16286
2270
9489
2
2
-
1
-
-
104553
Max GVW (tons)
42.76
67.14
69.92
83.87
108.30
90.29
95.70
-
101.80
-
-
Table 3: Number of vehicles and maximum GVW in each category – Peshawar
Truck Configuration (Number of Axles)
Total
2
3
4
5
6
7
8
9
10
11
12
Number of Trucks
150
66
33
3
154
1
1
1
-
-
-
411
Max GVW (tons)
30.42
37
44.93
54.37
88.12
80.456
82.70
87.80
-
-
-
1) Muhammad Wala Bridge – Sangjani
Muhammad Wala Bridge was constructed in 2010.
This bridge consists of pre-stressed and
simplysupported girders having a clear span of
47.2 m. Overall width of the bridge is 12.09 m and
road waywidth is 12.05 m. It is a three lane bridge,
having 180 mm deck thickness and 100 mm thick
wearingsurface and consists of four pre-stressed
concrete girders.
2) Mansoor Bridge–Mullan Mansoor
Mansoor Bridge is identical to Muhammad Wala
Bridge with a clear span of 47.19 m. This
bridgewas constructed in 2009. It consists of four
pre-stressed girders having a span of 47.19 m and
3.03 mspacing between girders. Again it is a three
lane bridge, having 180 mm deck thickness and
100 mm(average) thick wearing surface.
3) Bagh-e-Naran Bridge – Peshawar
This is a 20 years old bridge having a clear span of
12.8 m. This bridge consists of pre-stressed and
simply supported girders. Overall width of the
bridge is 8.69 m and road way width is 7.39 m. It
is a two lane bridge, having 190 mm deck
thickness and 100 mm thick wearing surface. It
consists of five pre-stressed concrete girders and
spacing between each girder is 1.9 m.
Similarly, maximum load effects were also calculated
for HL-93 (AASHTO design truck) and Class Adesign
truck described in 1967 Pakistan Code of Practice for
HighwayBridges 1967. Normalized load effects were
calculated by dividing the actual truck moment with the
momentof HL-93 and Class A design truck.

Journal of Environmental Treatment Techniques 2017, Volume 5, Issue 4, Pages: 132-140
134
4 Extrapolation of live load effects to 75
Years Return Period
As per AASHTO LRFD code, moment and shear
effects obtained from actual recorded truck data needs to
be extrapolated to 75 years using statistical techniques for
predicting the maximum value the bridge has to encounter
over its design life period. Different techniques were
earlier used to extrapolate the value for data projection to
75 years by Nowak (1993, 1994, NCHRP 1999) and
Kozikowski (2009) etc. In this paper three methods (non-
parametric fit method, Convolution or numerical
integration method and CDF projection method were used
for projecting the load effects to 75 years as was done in
previous researchers.
For calculating maximum mean live load effect in 75
years, extrapolation of a CDF plotted on probability plot
is required. ADTTis used to find the standard normal
variable ‘z’, a corresponding values on vertical axis for
different return period. ADTT is also used to find the
standard normal variable (z) on vertical axis of CDFs of
moment and shear fordifferent return periods. ADTT for
one day at Sangjani represents 1289 vehicle.
Correspondingprobability is 1/1289=0.000775795 and its
‘z’ value is 3.16. Similarly the data for two weeks
represents18,275 vehicles. Corresponding probability is
0.0000547 and ‘z’ value is equal to 3.87. In the same
waysix months of truck traffic probability is equal to
4.33383E-06 and standard normal variable is equal to4.45.
Similar calculations for standard normal variable were
done for other two bridges. Fordetermination of
probability and standard normal inverse for 75 year return
period we assumed that noabrupt increase in the traffic
volume occurs during the same period using available
ADTT for six monthsas was done by earlier researchers
(Kozikowski, 2009). Table 4 summarizes the different
values ofnumber of trucks ‘N’, probability ‘1/N’ and
standard normal inverse ‘z’ for 75 years return period for
allthe three bridges. Number of trucks for 75 years is
calculated by multiplying 75 with number oftrucks in one
year. ‘N’ for Sangjani for 75 years is:
N
75
= 75 x 461486 = 34611450
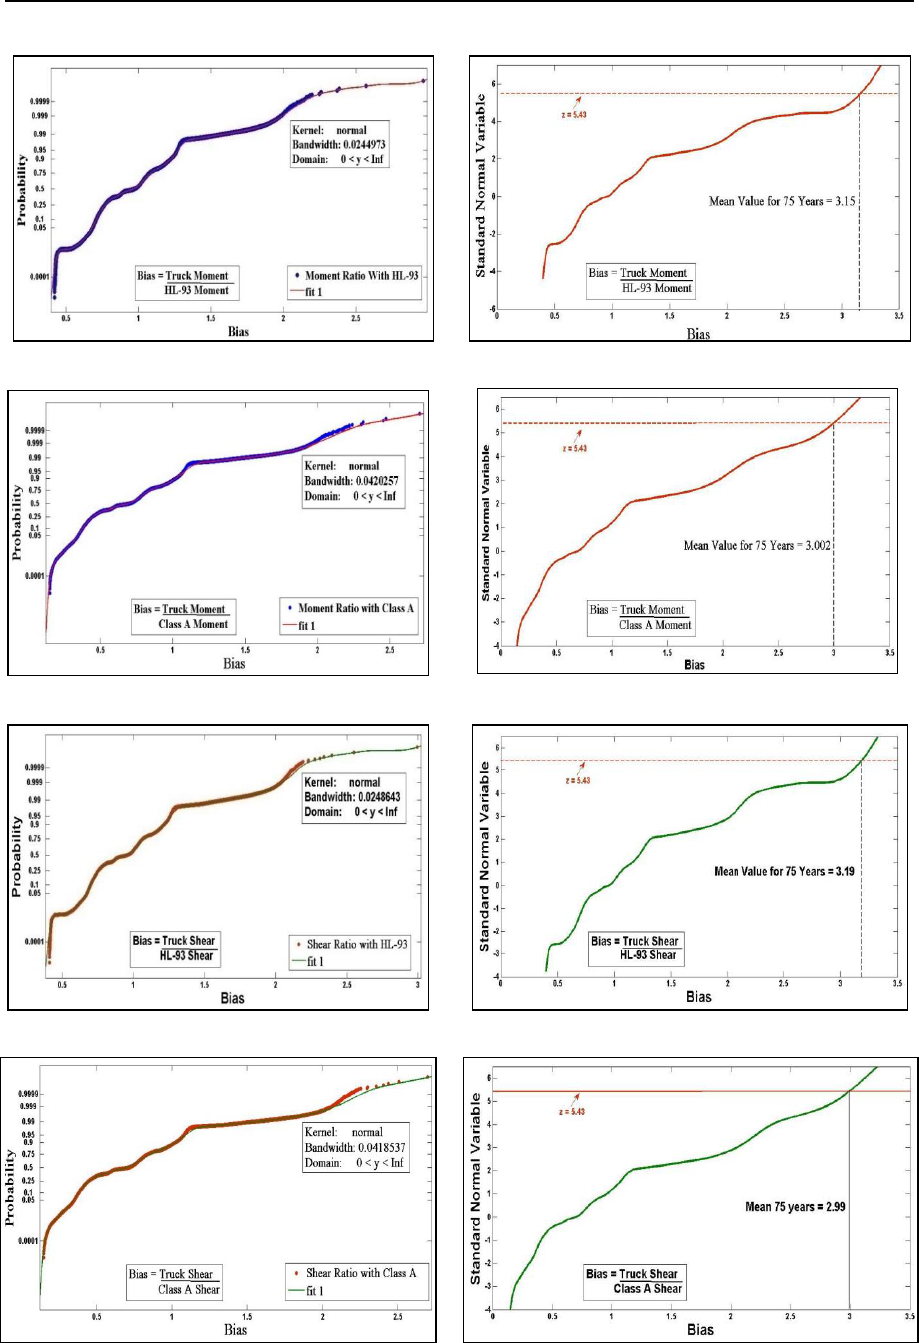
4.1 Non-parametric Method
Extension of upper tail was performed using non-
parametric approach. Method was applied for both shear
and moment. CDF and non-parametric fit for moment
ratio with AASHTO design vehicle (HL-93) and CPHB
design vehicle (class A only)for Sangjani bridge at
Sangjani are shown in Figure 1 and for shear ratio in
Figure 2 respectively.Trend of the tail fit depends on the
distance of last point of the data set with the others.
Extreme value theory is used to determine the distribution
of 75 years live load. All the mean maximum values for
75 years return period and statistical parameters for both
moment and shear is summarized in Table 5.
For Sangjani bridge, mean maximum value of
moment ratio corresponding to 75 years return period
using non-parametric fit having a ‘z’ value of 5.43 (refer
Table 4) is 3.15 and the COV is 0.22 for HL-93 truck as
shown in Figure 1. Mean value of maximum moments for
class A truck is equal to 3.002 and the COV (coefficient
of variation) is 0.39 as shown inFigure 2. In case of
extrapolated values of shear for HL-93 truck, the mean
maximum shear is equal to 3.19 (refer figure 3)and the
COV is 0.23whereas, for class A truck, the mean
maximum shear is 2.99 (refer figure 4) and COV is
0.39.Similarly, the mean maximum moment/shear for
other two bridges is tabulated in Table 5.
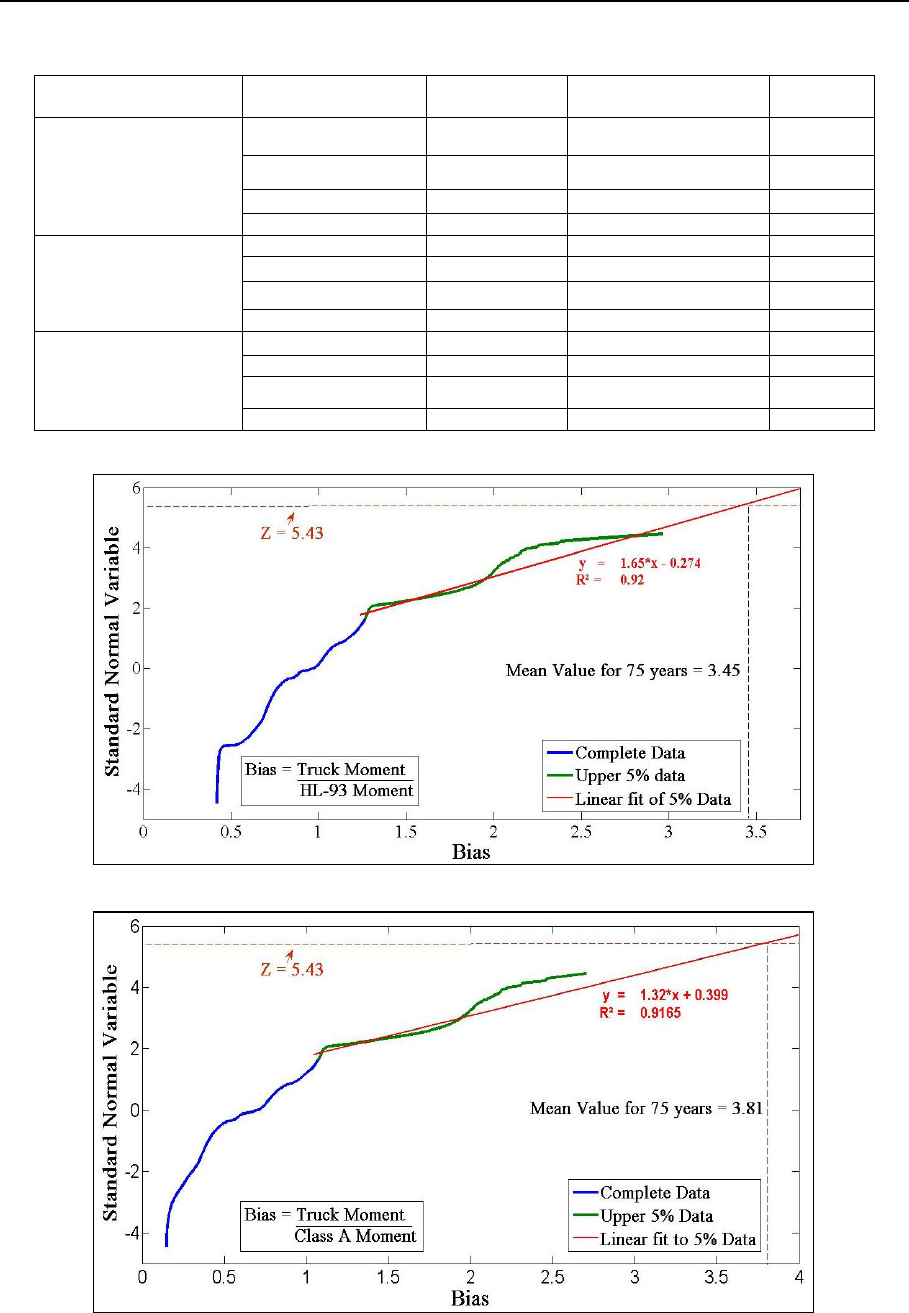
3.1.2 Convolution Method
Convolution method also called numerical integration
was used in NCHRP (National Cooperative Highway
Research Program) 683 (NCHRP 683, 2012) for
calculation of maximum load effect. This method is used
to obtain the maximum expected value for the required
return period (75 years in case of bridge design) by using
the numerical integrations of the collected WIM data.
Procedure as explained in NCHRP-683 was applied for
normalized moment and shear using the design vehicles of
AASHTO and CPHB. Using MATLAB, normal or linear
fit was applied for extrapolating and estimating the mean
maximum load effect. Figures 5 to 8 provides the
information about the normal fit load effects and projected
values of moments and shear for Sangjani Bridge.
Table 4: Number of trucks with corresponding probability and Time Period
Time Period 75 years
Number of Trucks (N)
Probability (1/N)
Standard Normal Inverse ‘z’
Sangjani
34611450
2.88922E-08
5.43
Mansoor
28478400
3.51143E-08
5.39
Peshawar
101606400
9.8419E-09
5.61
Following techniques were used to obtain Mean Maximum Moment and Shear for 75 years return period:
Journal of Environmental Treatment Techniques 2017, Volume 5, Issue 4, Pages: 132-140
135
Figure - 1a: Nonparametric fit– M
HL-93
– Sangjani
Figure- 1b: Extrapolation of M
HL-93
by Nonparametric fit -
Sangjani
i
Figure -2a: Nonparametric fit – M
Class A
- Sangjani
Figure -2b: Extrapolation of M
Class A
by Nonparametric fit -
Sangjan
Figure -3a: Nonparametric fit – V
HL-93
- Sangjani
Figure -3b: Extrapolation of V
HL
-
93
by Nonparametric fit –
Sangjani
Figure-4a: Nonparametric fit – V
Class A
-Sangjani
Figure-4b: Extrapolation of V
Class A
by Nonparametric fit –
Sangjani
Journal of Environmental Treatment Techniques 2017, Volume 5, Issue 4, Pages: 132-140
136
Table 5: Mean Maximum Moment(M) and Shear(V) for 75 years by Nonparametric fit
Stations
Moment/Shear
Recorded Data
Extrapolated value to
75 Years
COV
Sangjani – Bridge
M
Truck
/M
HL-93
2.96
3.15
0.22
M
Truck
/ M
Class A
2.70
3.002
0.39
V
Truck
/V
HL-93
2.99
3.19
0.23
V
Truck
/ V
Class A
2.70
2.99
0.39
Mansoor - Bridge
M
Truck
/M
HL-93
2.07
2.21
0.27
M
Tuck
/M
Class A
2.07
2.39
0.48
V
Truck
/V
HL-93
2.12
2.27
0.28
V
Truck
/Vc
lass A
2.16
2.49
0.49
Peshawar - Bridge
M
Truck
/ M
HL-93
1.52
2.16
0.26
M
Truck
/M
Class A
1.60
2.42
0.31
V
Truck
/ V
HL-93
1.62
2.65
0.29
V
Truck
/V
Class A
1.72
3.13
0.36
Figure 5: Extrapolation by Convolution Method for M
HL-93
– Sangjani
Figure 6: Extrapolation by Convolution Method for M
Class A
– Sangjani
Journal of Environmental Treatment Techniques 2017, Volume 5, Issue 4, Pages: 132-140
137
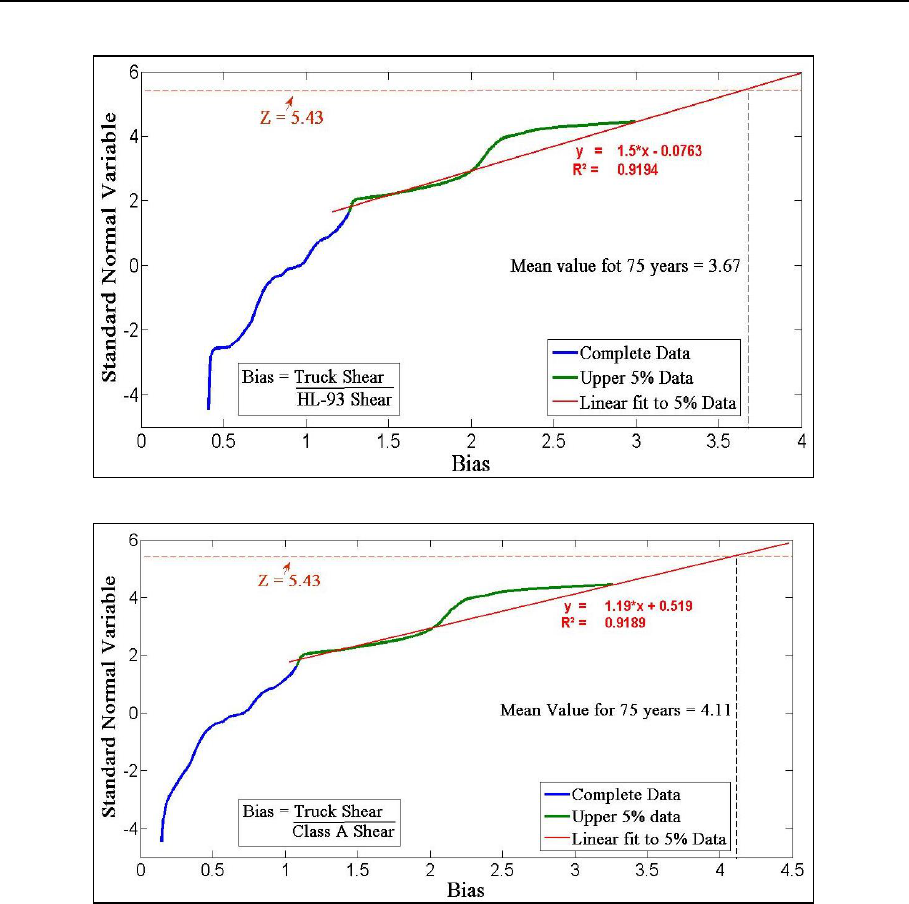
Figure 7: Extrapolation by Convolution Method for V
HL-93
– Sangjani
Figure 8: Extrapolation by Convolution Method for M
Class A
– Sangjani
Coefficient of determination ‘R
2
’ found from
regression analysis is around 0.92 which shows that it is
not a good fit in all the cases.Summary of the extrapolated
values for 75 years using convolution method is tabulated
in Table 6 for all the three bridges.
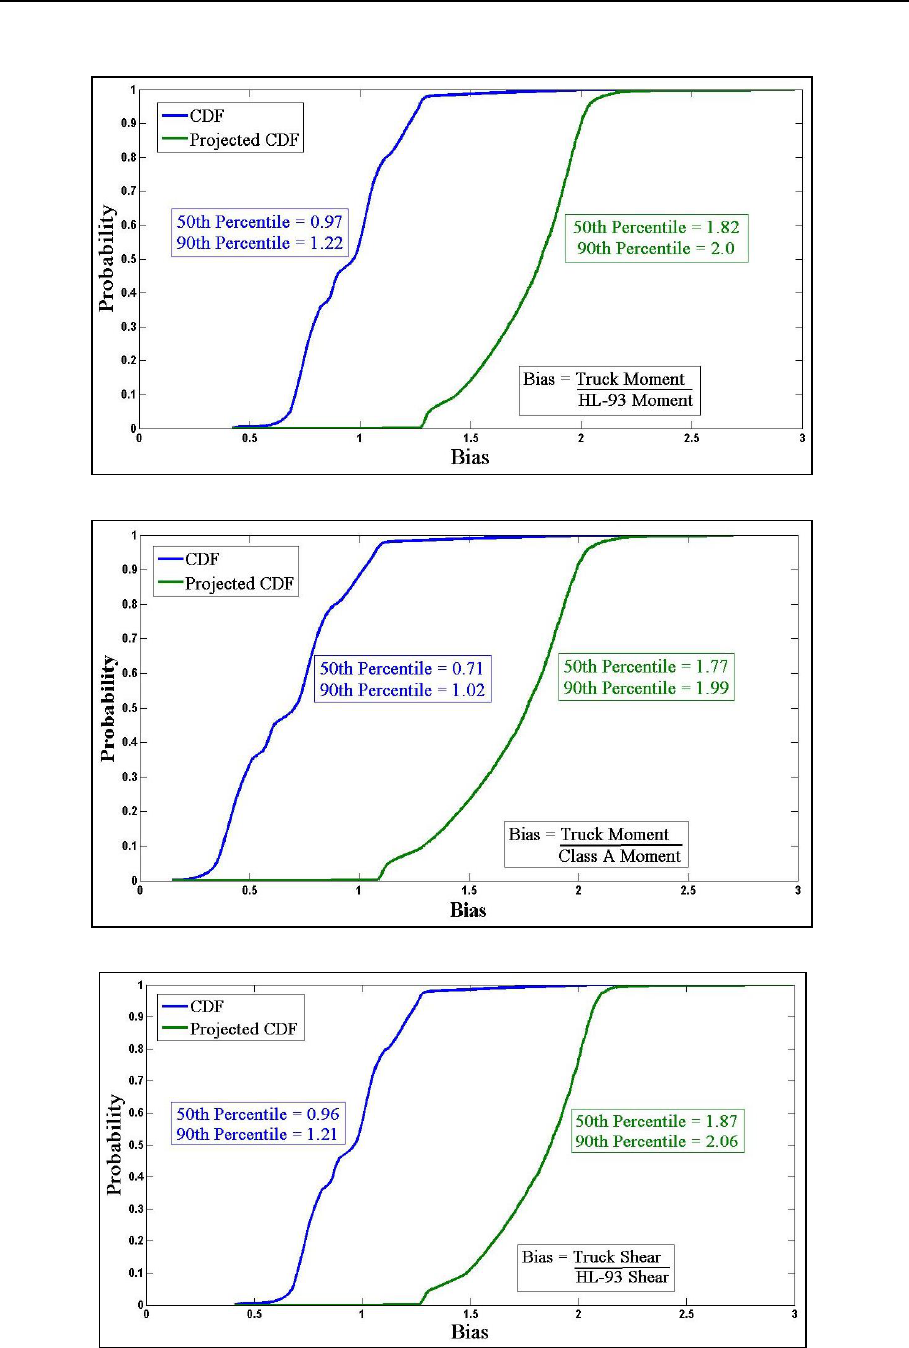
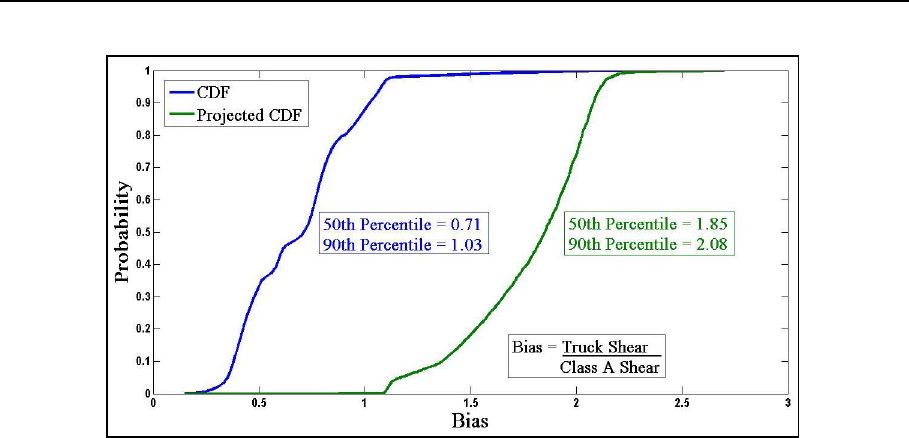
3.1.3 CDF Projection Method
Research report RC-1413 conducted by John W. van
de Lindt, Gongkang Fu, Reynaldo M. Pablo Jr, and
Yingmin Zhou for Michigun Department of
Transportation in 2002 for investigation of current design
load, was followed to reach to maximum 75 years load
effects on the bridge. ADTTacquired for all the three sites
were used to projects the live load effects using AASHTO
design vehicle and CPHB class ‘A’ design vehicle. EDD
(equivalent days of data) for each data set was calculated
from ADTT using the formula:-
EDD = m / ADTT (1)
where, ‘m’ is the total length of the data set. RDD
(required days of data) was calculated next as the number
of days in one year multiplied by the number of years to
which the data is to be projected i:e
RDD = 75 years x 365 days per year
= 27375 days
From the empirical cumulative distribution function, ith
ranked load effect can be expressed as
Fi = i / m (2)
‘n’ value is required to be calculated so that CDF can be
projected from EDD in each data set. n value is calculated
as
n = RDD / EDD (3)
The projected CDF (F
75
) can be calculated as F
75
= F
i
n
(4)
An assumption is made here that each time period of
duration EDD within the RDD time period is statistically
independent of each other. Mean value of the projected
dataset ‘F
75
’ can be read directly as the point on abscissa
corresponding to 0.5 on the CDF. Standard deviation of

Journal of Environmental Treatment Techniques 2017, Volume 5, Issue 4, Pages: 132-140
138
the projected dataset can be determined by using the best
fit numerical technique. Therefore COV can be easily
calculated by dividing the standard deviation with mean
value of the projected data set. Results of the normalised
moments and shear for Sangjani are shown in Table 7. 90
th
percentile value was selected here to find the projected
value. 90
th
percentile means only 10 % values are above
it. Empirical CDF and projected CDF for moment and
shear ratios with HL-93 design truck and Class A design
truck at Sangjani is shown in Figure 9 to 12.
Projected mean maximum values of normalised
moments and shear for all the three sites with the methods
explained is tabulated in theTable 7.
4 Comparison of Results
Maximum mean 75 years extrapolated values for
Sangjani, Mullan Mansoor and Peshawarusing all the
three methods are presented in Table 8 below.
Table 6: Mean Maximum Moment(M) and Shear(V) for 75 years by Convolution Method
Stations
Moment/Shear
Recorded
Data
Extrapolated value to
75 Years
COV
R
2
Sangjani – Bridge
M
Truck
/M
HL-93
2.96
3.45
0.22
0.92
M
Truck
/ M
Class A
2.70
3.81
0.39
V
Truck
/V
HL-93
2.99
3.67
0.23
V
Truck
/ V
Class A
2.70
4.11
0.39
Mansoor Bridge
M
Truck
/M
HL-93
2.07
3.32
0.036
0.87
M
Tuck
/M
Class A
2.07
3.66
0.041
V
Truck
/V
HL-93
2.12
3.43
0.036
V
Truck
/Vc
lass A
2.16
3.83
0.041
Peshawar Bridge
M
Truck
/ M
HL-93
1.52
2.22
0.025
0.86
M
Truck
/M
Class A
1.60
2.42
0.027
V
Truck
/ V
HL-93
1.62
2.44
0.026
0.97
V
Truck
/V
Class A
1.72
2.70
0.028
Table 7: Mean Maximum Moment (M) and Shear (V) for 75 years by CDF Projection Method
Stations
Moment/Shear
Recorded Data
(90
th
Percentile)
Extrapolated value to 75
Years (90
th
Percentile)
COV
Sangjani Bridge
M
Truck
/M
HL-93
1.22
2.0
0.22
M
Truck
/ M
Class A
1.02
1.99
0.39
V
Truck
/V
HL-93
1.21
2.06
0.23
V
Truck
/ V
Class A
1.03
2.08
0.39
Mansoor Bridge
M
Truck
/M
HL-93
1.22
1.90
0.27
M
Tuck
/M
Class A
1.03
1.87
0.48
V
Truck
/V
HL-93
1.23
1.98
0.28
V
Truck
/Vc
lass A
1.05
1.96
0.49
Peshawar
Bridge
M
Truck
/ M
HL-93
Applying this method for projection to 75 years return period on small
dataset of Peshawar having only 411 trucks, resulted in zero values
M
Truck
/M
Class A
V
Truck
/ V
HL-93
V
Truck
/V
Class A
Table 8: Comparison ofMean Maximum Moment (M) and Shear (V) for 75 years using Different methods
Stations
Moment/Shear
Recorded
Data
Nonparametric
Fit Method
Convolution
Method
CDF Projection
Method
Sangjani
Bridge
M
Truck
/M
HL-93
2.96
3.15
3.45
2.0
M
Truck
/ M
Class A
2.70
3.002
3.81
1.99
V
Truck
/V
HL-93
2.99
3.19
3.67
2.06
V
Truck
/ V
Class A
2.70
2.99
4.11
2.08
Mansoor
Bridge
M
Truck
/M
HL-93
2.07
2.21
3.32
1.90
M
Tuck
/M
Class A
2.07
2.39
3.66
1.87
V
Truck
/V
HL-93
2.12
2.27
3.43
1.98
V
Truck
/Vc
lass A
2.16
2.49
3.83
1.96
Peshawar
Bridge
M
Truck
/ M
HL-93
1.52
2.16
2.22
No results produced
M
Truck
/M
Class A
1.60
2.42
2.42
V
Truck
/ V
HL-93
1.62
2.65
2.44
V
Truck
/V
Class A
1.72
2.16
2.22
Journal of Environmental Treatment Techniques 2017, Volume 5, Issue 4, Pages: 132-140
139
Figure – 9: 90
th
percentile of projected M
HL-93
to 75 years – Sangjani
Figure – 10: 90
th
percentile of projected M
ClassA
to 75 years – Sangjani
Figure – 11: 90
th
percentile of projected V
HL-93
to 75 years – Sangjani
Journal of Environmental Treatment Techniques 2017, Volume 5, Issue 4, Pages: 132-140
140
Figure – 12: 90
th
percentile of projected V
ClassA
to 75 years – Sangjani
5 Conclusion
Non-parametric method was used for projecting the
load effect as it did not involve any known type of
distribution. This method is developed on the basis of
given data without involving any parameters like skew,
mean, variance etc. The advantage of this method over the
parametric one is that it instead of following any defined
shapes it adjusts itself to the probability density function
to any distribution of data (Faucher et al. 2001). The
results achieved by using this method are closer to the
realistic value as compared to the other methods. The
convolution method adopted in NCHRP 683 uses the
linear fit to extrapolate the maximum value. Accuracy of
results also depends on the coefficient of determination
(R
2
) value which shows how best the data has been fit.
Normally anything above 0.95 is considered to be a good
fit in engineering practices. R
2
values for all the data sets
are below 0.95. Hence the resulting extrapolated values
using convolution method were not used for reliability
analysis. CDF Projection Method resulted in zero values
for small data set of Peshawar. Moreover the values
obtained for Sangjani and Mullan Mansoor were lesser
than the values calculated from other methods.
Extrapolated values using this method was not used for
reliability analysis.
References
AASHTO “LRFD Bridge Design Specifications.” 6th
Edition 2012, Washington, D.C.
Enright, B. (2010). “Simulation of Traffic Loading on
Highway Bridges”, PhD thesis, School of
Architecture, Landscape and Civil Engineering,
University College Dublin, Ireland.
Hwang, E. S. and Nowak, A. S. (1991). "Simulation of
Dynamic Load for Bridges." Journal of
Structural Engineering, ASCE, Vol. 117, pp. 1413-
1434.
Kozikowski, M. (2009), “WIM Based Live Load Model
for Bridge Reliability”, Ph.D Thesis,
University of Nebraska – Lincoln.
Lindt, J.W. and GongKang, F. (2002). “Investigation of
the adequacy of current design loads in the
state of Michigan.” MDOT Research Report RC-
1413.
Nowak, A. S. (1993), “Live load model for highway
bridges.” Structural Safety, 13, 53-66.
Nowak, A. S. (1994), “Load model for bridge design
code.” Canadian Journal of Civil Engineering, 21,
36-49.
Nowak, A. S. (1999). "Calibration of LRFD Bridge
Design Code." 368, NCHRP, Washington,
D.C.
O’Brien, E., Enright, B., and Getachew, A. (2010).
“Importance of the tail in truck weight
modeling for bridge assessment.” Journal of
Bridge Engineering, 15(2):210–213.
Pakistan Code of Practice for Highway Bridges (CPHB,
1967), Lahore Pakistan.
Sivakumar, B., Ghosn, M. and Moses, F. (2008).
"Protocols for Collecting and Using Traffic Data
in Bridge Design." National Cooperative
Highway Research Program, TRB, Washington
DC.
Sivakumar, B., Ghosn, M., Moses, F. and TranSystems
Corporation. (2011). “Protocols for Collecting and
Using Traffic Data in Bridge Design." National
Cooperative Highway Research Program, TRB,
Washington DC.